Independent SCM simulation platform that turns cost-structure visibility into executable profit decisions — without replacing your existing systems.
These are not failures of effort or talent. They are architectural defects in how decisions connect to financial outcomes. In every portfolio we have examined — across Korea, the US, and Japan — these patterns repeat.
You removed the loss-making SKU. Costs didn't shrink — they redistributed across remaining products, creating new losses where none existed before.
Spending months improving forecast accuracy by 2%, while structural margin leakage from MOQ conflicts, pricing erosion, and bottleneck misallocation goes entirely undiagnosed.
Your planner manages 500 SKUs × channels × lots in Excel. The real question isn't what they're doing — it's what they structurally cannot see.
The highest unit-margin product consumes disproportionate bottleneck time. Prioritising it actually destroys total profit.
Holding cost accumulates while negotiation leverage declines. Once the curves cross, your options vanish.
Your deletion model assumes freed capacity is absorbed. Your capacity model assumes the current mix holds. Your inventory model assumes the current plan is stable. Change one and the rest are already wrong.
Every inventory position is evaluated not as cost, but as an investment asset — measured by its financial contribution across eight dimensions.
Decision metric principle: MC/BH for short-term scheduling (fixed costs don't change with sequencing). PROCO for portfolio decisions (captures SKU-specific fixed costs). CEBIT for reporting only — never for decisions.
Confirmed daily production → API to APS/ERP → MES. Human-in-the-Loop: the planner always has the final word.
Streamlit dashboard + Cortex AI Agent. Natural language → mathematical constraints. Scenario comparison in seconds.
LP/MIP solver on Snowflake SPCS. Objective: maximise Σ(MC/BH × volume). 500 SKU × 10 sites × 14 days in under 3 minutes.
CDC → Dynamic Tables. Real-time Cost Table: SKU × channel × site PROCO. Cost Drivers auto-refreshed.
Each subsidiary building its own AI system faces local talent constraints and capability limits. A centralised service model eliminates this barrier.
Global data integration, simulation engine operation, Impact alternative generation, algorithm refinement. One team serves all subsidiaries from a single cloud platform.
Each subsidiary's planner receives pre-computed Impact alternatives, interprets them in local context, selects the preferred scenario, and executes. No local AI expertise required.
Execution results flow back to the Hub. Post-Game Analysis compares predicted vs. actual outcomes. Algorithms learn continuously. Override patterns are studied and absorbed.
Why this model works: Short lead-time environments receive capacity-based production mix scenarios. Long lead-time environments receive global parts allocation scenarios. Same platform, different outputs — tailored to the operational reality.
| Decision Type | Metric | Rationale |
|---|---|---|
| Production scheduling (daily mix) | MC / BH | Only variable costs change with sequencing order. Including fixed costs in the objective function creates distortion. |
| Portfolio decisions (delete / keep / reprice) | PROCO | Captures SKU-specific fixed costs: listing fees, promotions, dedicated overheads. MC alone cannot see these. |
| Enterprise reporting | CEBIT | Reference only. Never for decisions — indirect cost allocation makes it structurally misleading for action. |
Each agent diagnoses, simulates, and recommends — with full financial impact visibility. The planner confirms. The system executes.
Automatically diagnoses the entire SKU portfolio: where money leaks, why it leaks, how severe it is, and what to do. Classifies every SKU into Deletion / Rationalisation / Normal with Track assignment.
Detects anomalous demand patterns, corrects ML over/under-prediction, and traces forecast error back to root causes — promotion miss, calendar gap, or POG omission.
Dynamically recalculates target inventory using a 3-axis classification (order frequency × CV × cycle regularity), replacing legacy fixed parameters with statistically grounded, tier-differentiated policies.
When capacity is constrained, simulates the optimal product mix using T_eff (MC per bottleneck hour) — not unit margin. Exposes margin-inversion traps invisible to traditional scheduling.
For confirmed loss-making SKUs, simulates the optimal discontinuation window — including fixed-cost redistribution impact, remaining inventory disposal, and dedicated raw-material run-down.
For ageing and slow-moving inventory, calculates the optimal markdown / channel-switch / write-off combination using NRV-based TCO comparison and category-specific Golden Zone analysis.
Built on Snowflake AI Data Cloud. Designed for elastic simulation, not static reporting.
Every component runs where the data lives — no extraction, no replication, no latency.
Phase-gated delivery. Each phase delivers a complete, usable capability — not a partial feature.
Data model construction + Agent build → Analysis service delivery + Feedback improvement cycle for each agent.
Production mix optimisation with LP/MIP solver. Deletion timing with overhead simulation. Disposition with Golden Zone analysis.
Daily S&OE profit optimisation with overnight Snowflake → Zionex sync. Factory sequencing PoC for high-changeover plants. Multi-objective function switching.
Cut-over principle: Each phase replaces a complete workflow — not a partial feature. If a planner still needs to open Excel to finish the task, adoption fails. Even during phased rollout, the user experience must be: "This task no longer requires a spreadsheet."
Measured per-subsidiary PoC. These are operational targets, not projections.
Financial visibility: Every SCM decision translates to PROCO impact — visible at the moment the decision is made, not reconciled weeks later.
Excel regression eliminated: Complete workflow cut-over ensures the system is where decisions are made — not where data is stored before being re-entered elsewhere.
Organisations that have built intelligence layers above their operational systems.
From rapid diagnostics to full platform build. Every engagement starts with data, ends with decisions.
Full-portfolio MC → PROCO analysis. Identify structural loss patterns, overhead allocation traps, and pricing erosion by channel. Prioritised action list with Track assignment.
Safety stock recalibration, multi-site rebalancing, ageing-based disposition triggers. Statistical foundation replacing legacy fixed parameters.
Snowflake-based 4-Layer architecture: data integration, optimisation engine, AI agent interface, execution handoff. Designed to sit above your ERP — not replace it.
Design, build, and deploy domain-specific AI Agents (Cortex AI) that diagnose, simulate, and recommend — connected to your data, governed by your decision rules.
From the LinkedIn series: practitioner perspectives on profit-oriented SCM, decision architecture, and the gap between planning systems and intelligence.
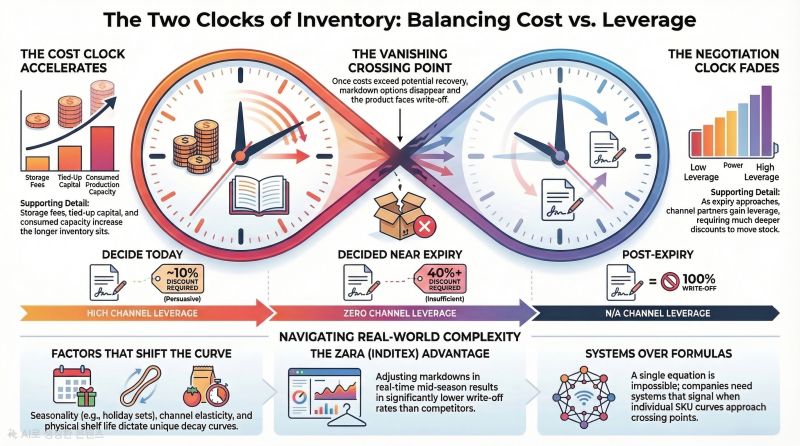
Inventory management involves two simultaneous, opposing metrics: the cost curve and the negotiation leverage curve. Understanding this intersection is critical before options vanish.
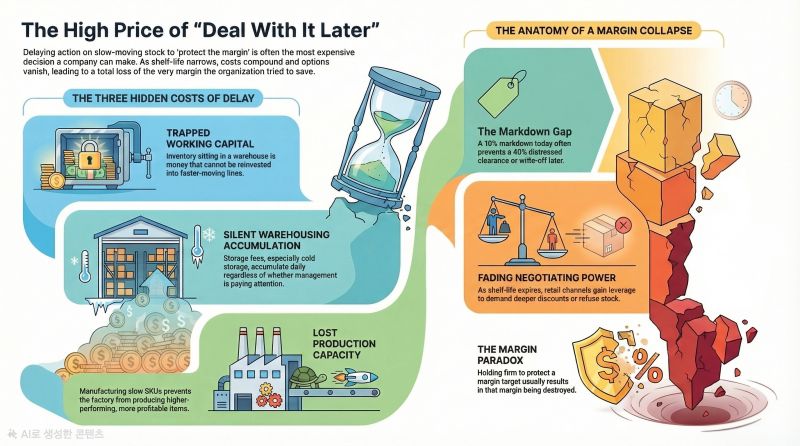
Delaying action on slow-moving inventory is consistently the most expensive decision an organisation can make, leading to total margin collapse.
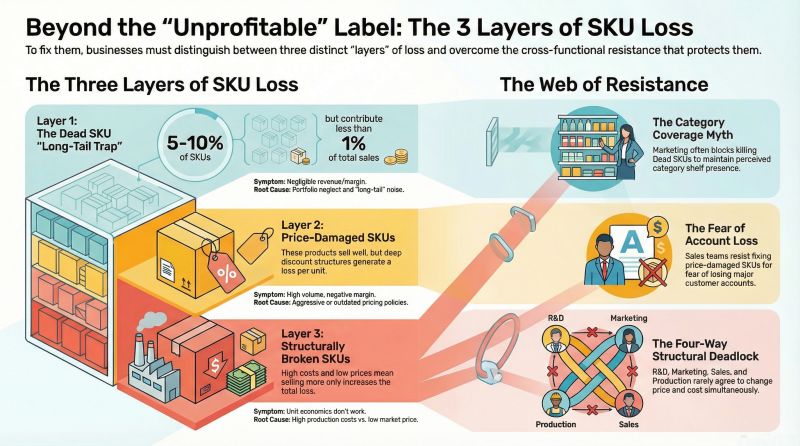
Classifying all loss-making SKUs under a single label prevents targeted resolution. Effective remediation requires distinguishing between three specific layers of loss.
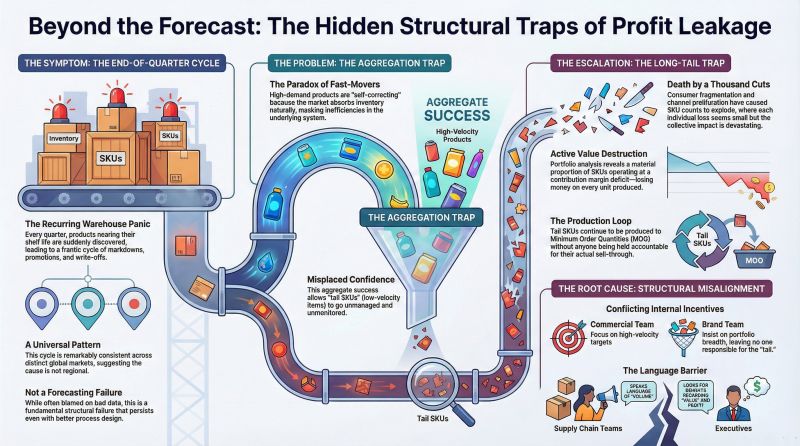
Profit leakage follows the same structure, wherever you look. The Aggregation Trap and the Long-tail Trap explain why loss-making SKUs survive undetected.
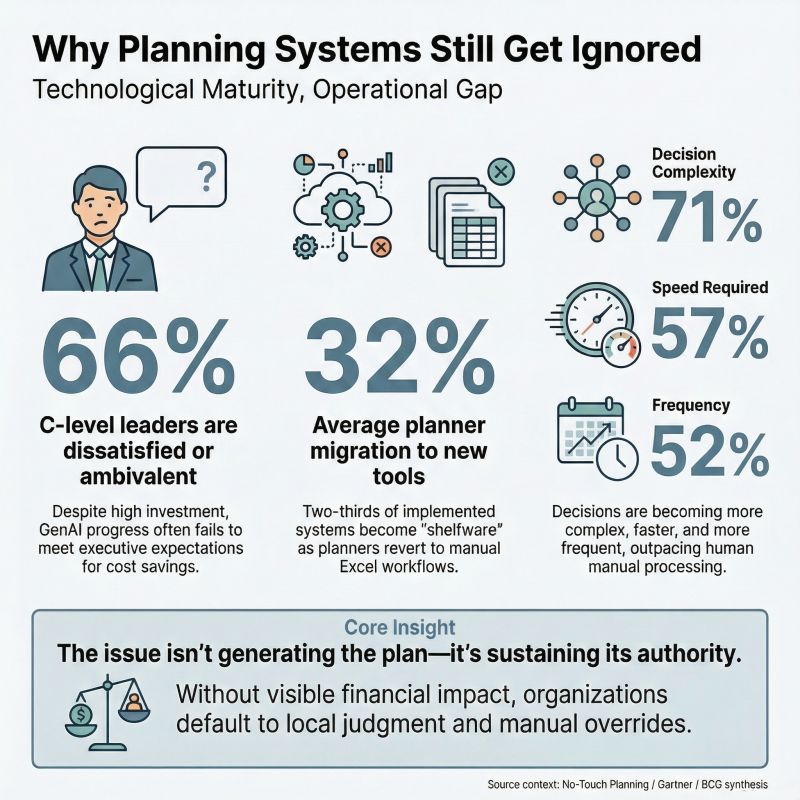
Planning systems do not all do the same job. Some consolidate plans. Others are where plans are actually formed, tested, and reshaped as conditions change. Only the second type moves closer to autonomy.
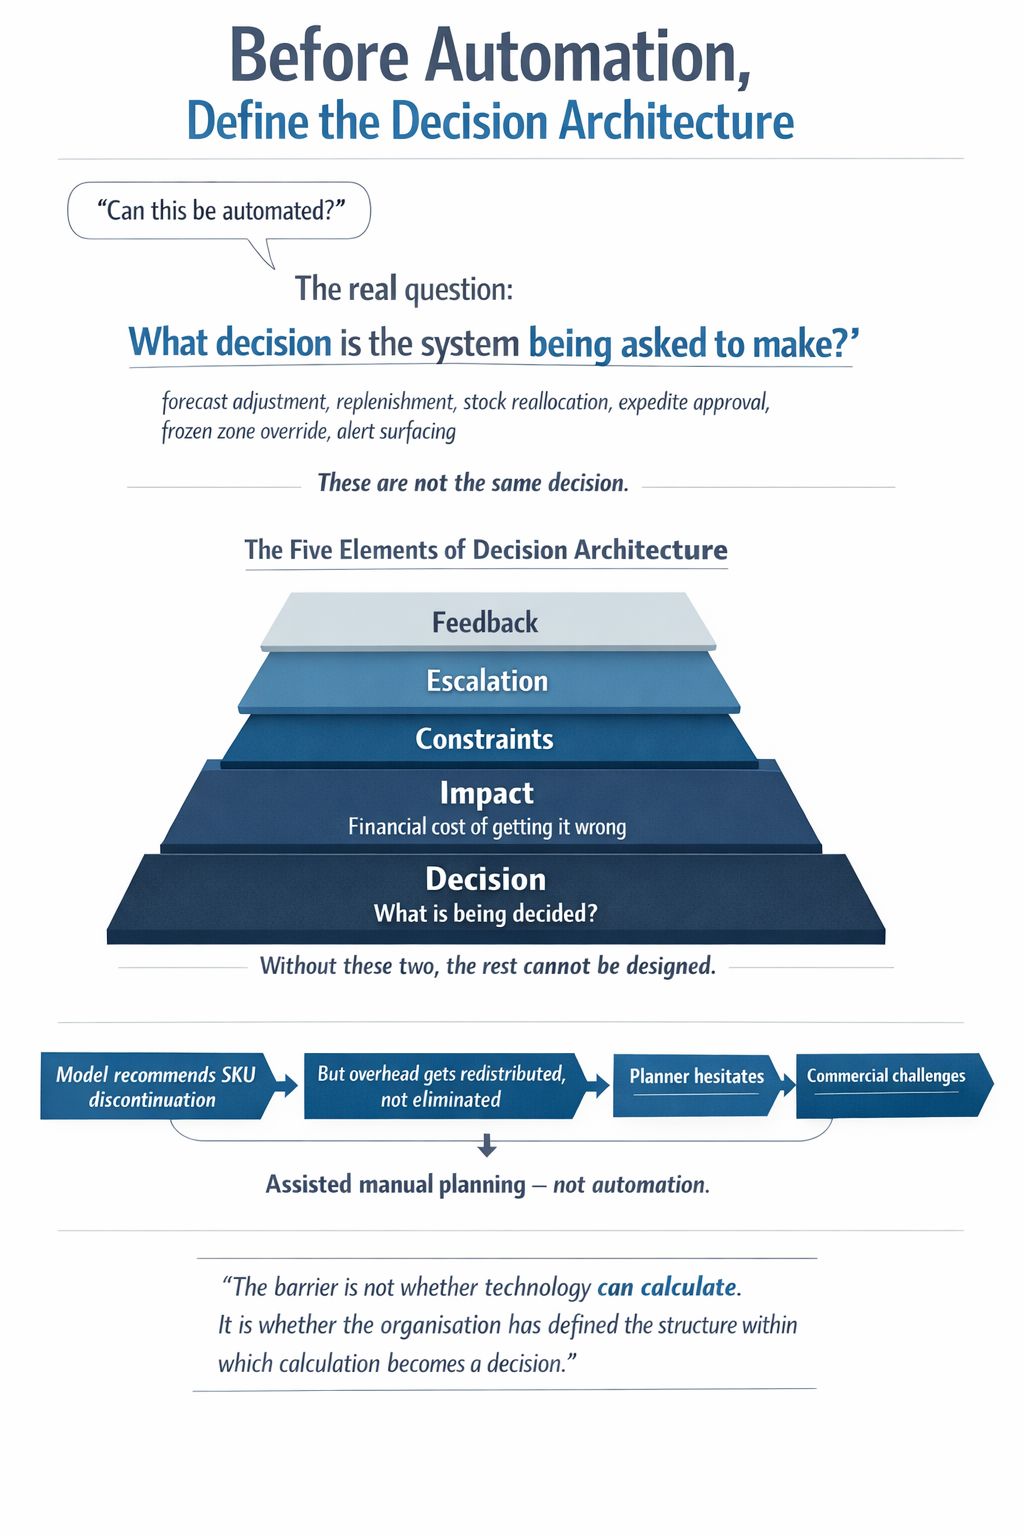
A system cannot meaningfully automate a decision that the organisation itself has not clearly defined. Five elements must be explicit before any planning decision becomes operationally credible.
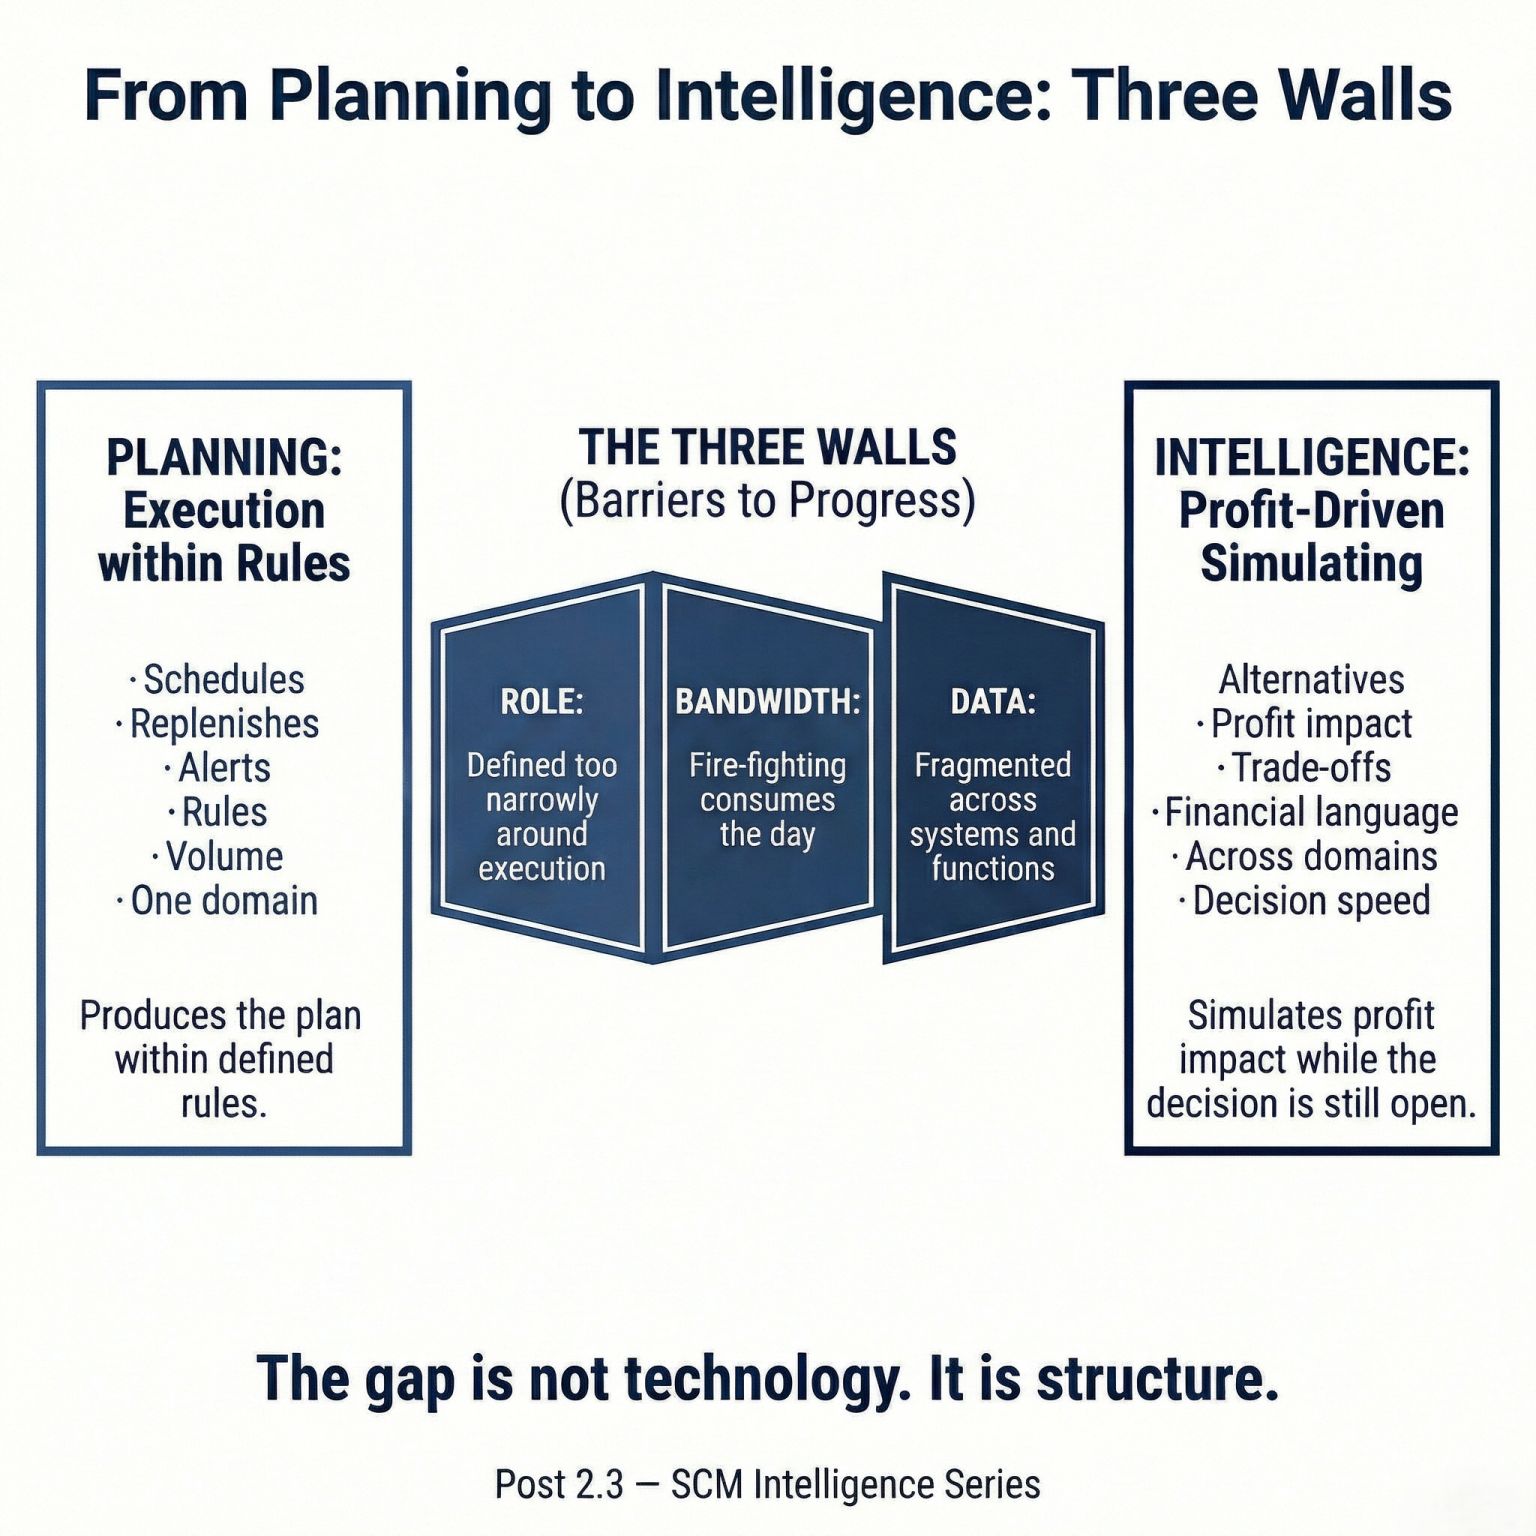
Planning tells you what the rules say should happen next. Intelligence tells you what happens to the margin when rules are broken — and whether breaking them might actually be the right answer.
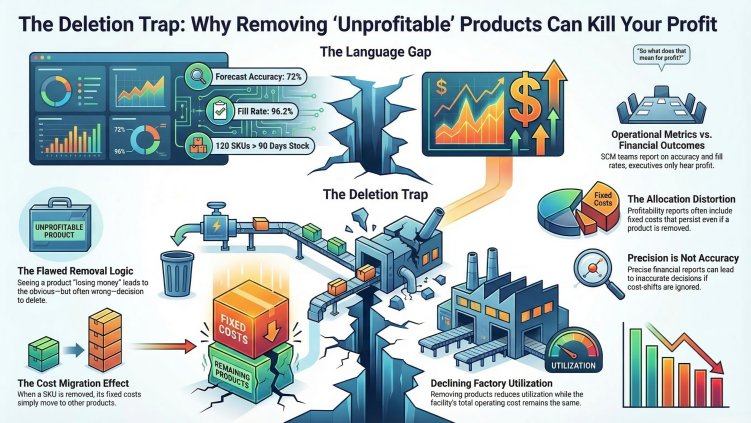
When a loss-making SKU is removed, the costs it absorbed don't disappear — they redistribute. The upside is capped. The downside is open-ended. Simulation before deletion is mandatory.
Whether you're exploring a profitability diagnostic, evaluating an intelligence platform build, or simply want to discuss structural challenges in your supply chain — we'd welcome the conversation.
Nex & Bridge designs independent SCM data analytics platforms and simulation environments. We focus on explaining existing operational facts to support clear decision-making — rather than replacing existing operational systems.